You need to have the necessary insights into an issue in order to develop a workable solution. Because unexpected faults and malfunctions frequently occur in distributed systems. Observability in modern applications makes it possible to identify the root causes and develop workable solutions.
Operating a distributed system is challenging due to the complexity of the system as well as the unpredictable nature of failure mechanisms. The number of potential failure scenarios is growing as a result of rapid software delivery, continuous build deployments, and current cloud architectures. Regrettably, standard monitoring technologies are no longer able to assist us in overcoming these obstacles.
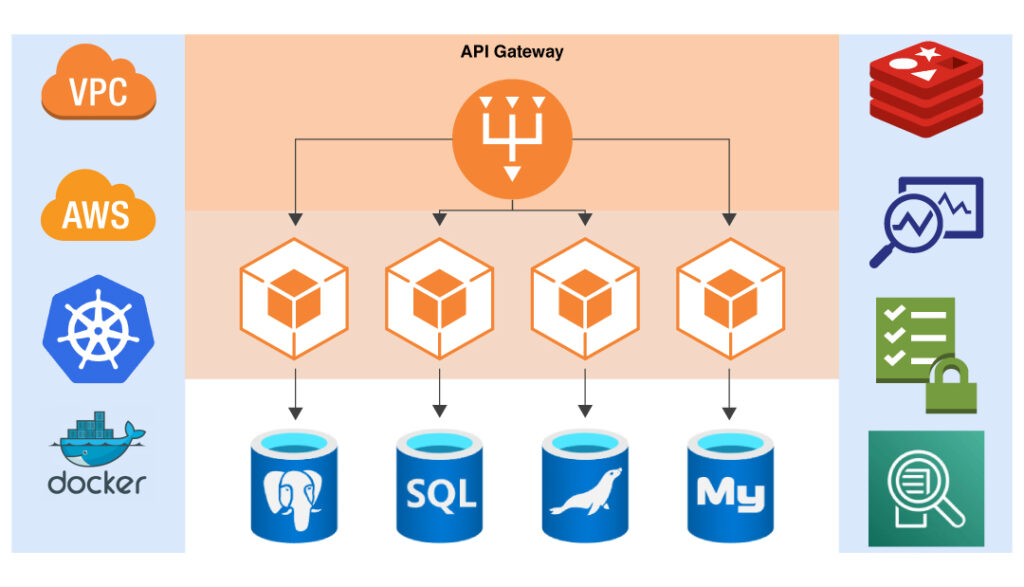
The monolithic architecture was first used by IT behemoths to construct their apps since it was more practical at the time. They all encountered similar challenges and eventually concluded that they should use microservices and event-driven architecture patterns. These patterns allow for individual creation, scaling, and deployment. The speed and scalability of application delivery have grown dramatically as a result, but on the downside, managing these microservice installations has added a new level of operational complexity. Working with older technology has the advantage of only having a small number of failures. It is simpler to design these complicated systems by using application programming interfaces (APIs) to expose fundamental business functions and facilitate service-to-service communication.
These four fundamental concerns are being addressed by any business or organization that is using these microservices and API-based architectures:
The term “observability” originated from control theory. It is a branch of engineering that concentrates on automating the control of a dynamic system based on input from the system. Such as water flow through a pipe or a car’s speed across hills and valleys.
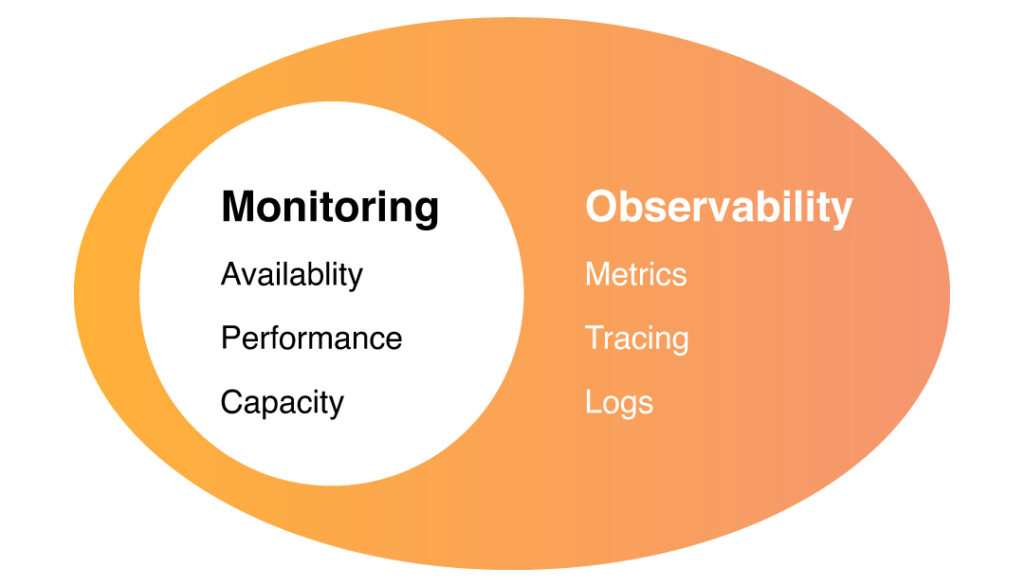
Observability is the ability to understand a complex system’s internal state or condition only based on the knowledge of its external outputs. The more visible the system is, the quicker and more precisely you can pinpoint the root cause of a performance problem without additional testing or coding.
APM systems collect telemetry, which includes application and system data known to be related to application performance problems, by routinely sampling it. It analyzes the telemetry in relation to key performance indicators (KPIs) and compiles the results in a dashboard. In order to notify operations and support teams of anomalous situations that need to be addressed in order to resolve or avoid difficulties.
APM systems can monitor and troubleshoot monolithic applications or conventional distributed applications. These applications issue new code regularly, and the processes and dependencies between application components, servers, and associated resources are well-known or simple to trace.
In recent days advanced development practices and cloud-native technologies are being adopted by organizations. Due to the adoption of modern applications and faster time to market. Some of the examples are Docker containers, Kubernetes, serverless functions, agile development, continuous integration, continuous deployment (CI/CD), DevOps, multiple programming languages, etc.
They are now releasing more services than ever as a result. APM’s once-a-minute data sampling, however, is unable to keep up with how frequently they are deploying new application components, in how many different places, in how many different languages, and for how vastly different amounts of time (for seconds or fractions of a second, in the case of serverless services).
Application observability solutions integrate with existing instrumentation built into application and infrastructure components. They provide tools to add instrumentation to these components in order to continually identify and gather application performance telemetry. The four primary telemetry kinds, the three observability pillars of logs, metrics, traces, and dependencies are the emphasis of application observability.
Modern application designs greatly improve scalability and resilience while streamlining the procedures for system deployment and change. DevOps teams must now more than ever achieve end-to-end observability due to the increasing complexity these systems bring.
Learn More: Application Modernization Services of Metaorange Digital


Copyright © 2022 metaorangedigital. All Right Reserved